
The 10 customer service KPIs to track in 2026
Découvrez les 10 KPIs (indicateurs clés de performance) indispensables pour évaluer la performance de votre service client et maximiser sa qualité à long terme.

According to a study conducted by American Express in 2022, 80% of customers consider customer service quality essential to their purchase decision. To offer a better customer experience, every business needs to identify areas for improvement within its customer service department. This is where key performance indicators (KPIs) come in.
These metrics provide a guide to excellence, helping teams monitor and assess the effectiveness of the actions they implement and make more informed decisions. However, with so many indicators available, knowing which ones to prioritize is not always easy.
Our goal is to give you the most relevant KPIs: the ones that offer a clear picture and help you build an excellent customer service operation.
Before exploring them in detail, here are the ten indicators we have selected and exactly what each one measures.
The 10 KPIs at a glance
| KPI | What it measures |
|---|---|
| CSAT (Customer Satisfaction Score) | The customer's assessment immediately after an interaction, on a scale of 1 to 5. |
| CES (Customer Effort Score) | The effort a customer has to make to get an answer or resolve a problem. |
| NPS (Net Promoter Score) | How likely a customer is to recommend your company to others, on a scale of 0 to 10. |
| Number of support tickets opened | The volume of requests received by customer service across all channels. |
| First Contact Resolution (FCR) | The share of requests handled during the first interaction, without a callback or follow-up. |
| Overall resolution rate | The share of requests resolved in total, regardless of the number of interactions required. |
| AHT (Average Handle Time) | The average time an agent spends on a request, from answering to closing it. |
| Customer churn rate | The share of customers who stop using your services over a given period. |
| SERVQUAL | The gap between the service quality customers expect and the quality they actually perceive. |
| SQI (Service Quality Indicator) | Perceived service quality based on specific criteria such as courtesy, speed, and the relevance of responses. |
1. Customer Satisfaction Score (CSAT)
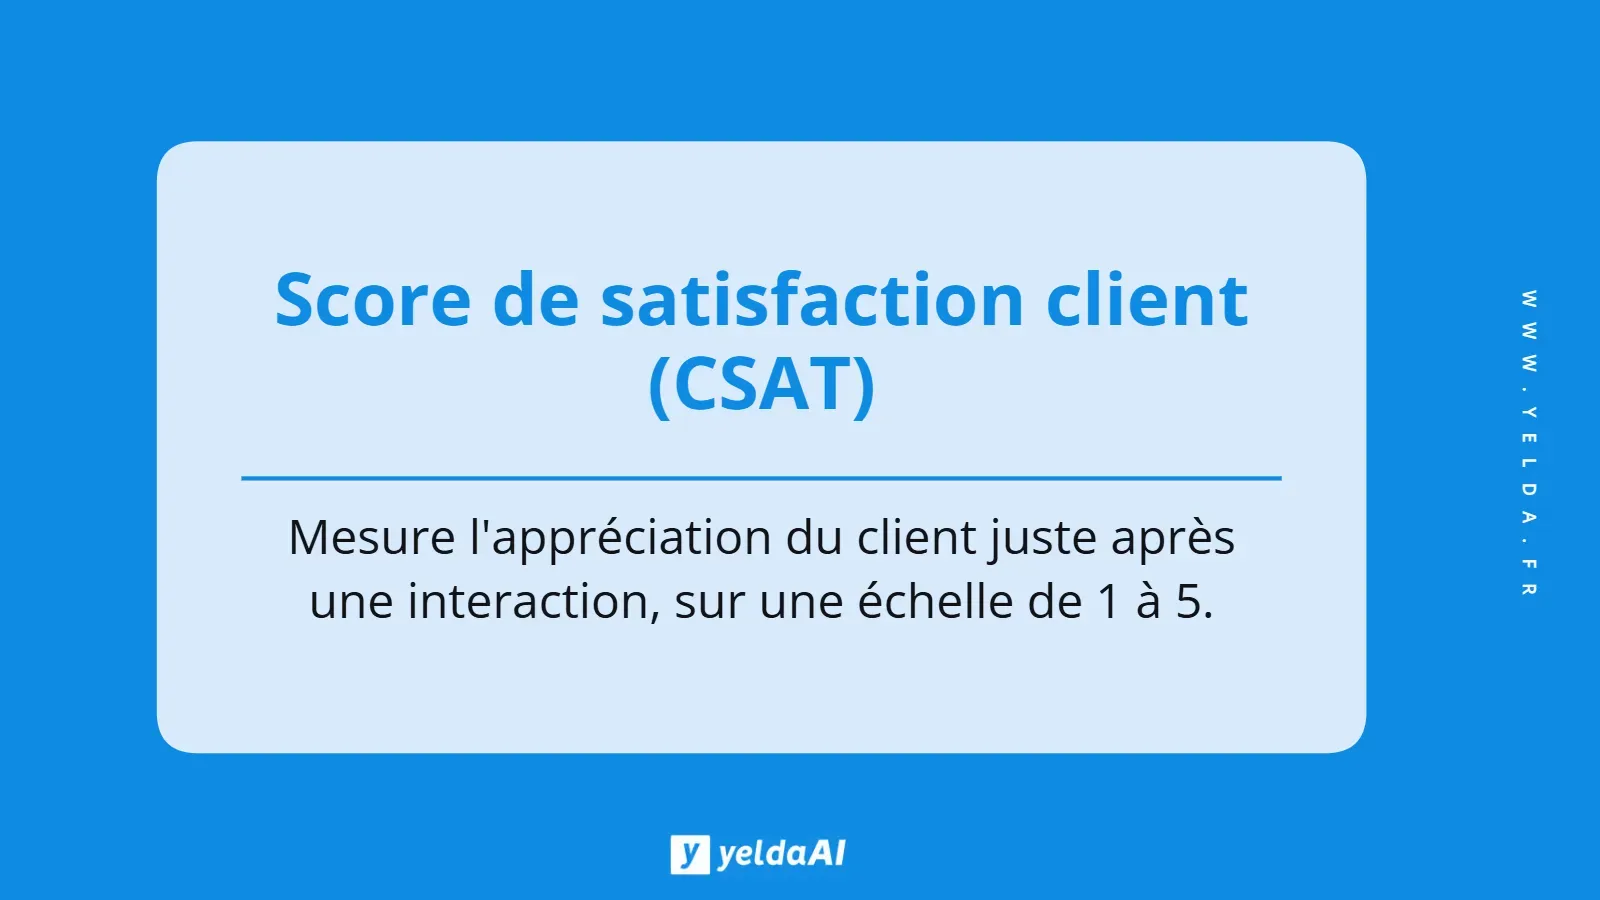
Short for Customer Satisfaction Score, CSAT is a key performance indicator that provides insight into customer satisfaction. It measures a customer's assessment following an interaction, whether after a service request, a purchase, or another experience.
Measuring this KPI offers several benefits:
- identifying the strengths and weaknesses of customer service;
- tracking changes in customer satisfaction over time;
- quickly identifying areas for improvement.
To calculate CSAT, ask customers to rate their experience after an interaction. Using a scale from 1 to 5, or from Very satisfied to Very dissatisfied, calculate the score by dividing the number of positive responses by the total number of responses, then multiplying the result by 100.
CSAT = (Number of positive responses / Total number of responses) × 100
2. Customer Effort Score (CES)
Also used to assess customer satisfaction, CES measures the effort customers make when interacting with support.
This KPI helps identify precisely where friction occurs in the customer journey. You can then take action to improve those points.
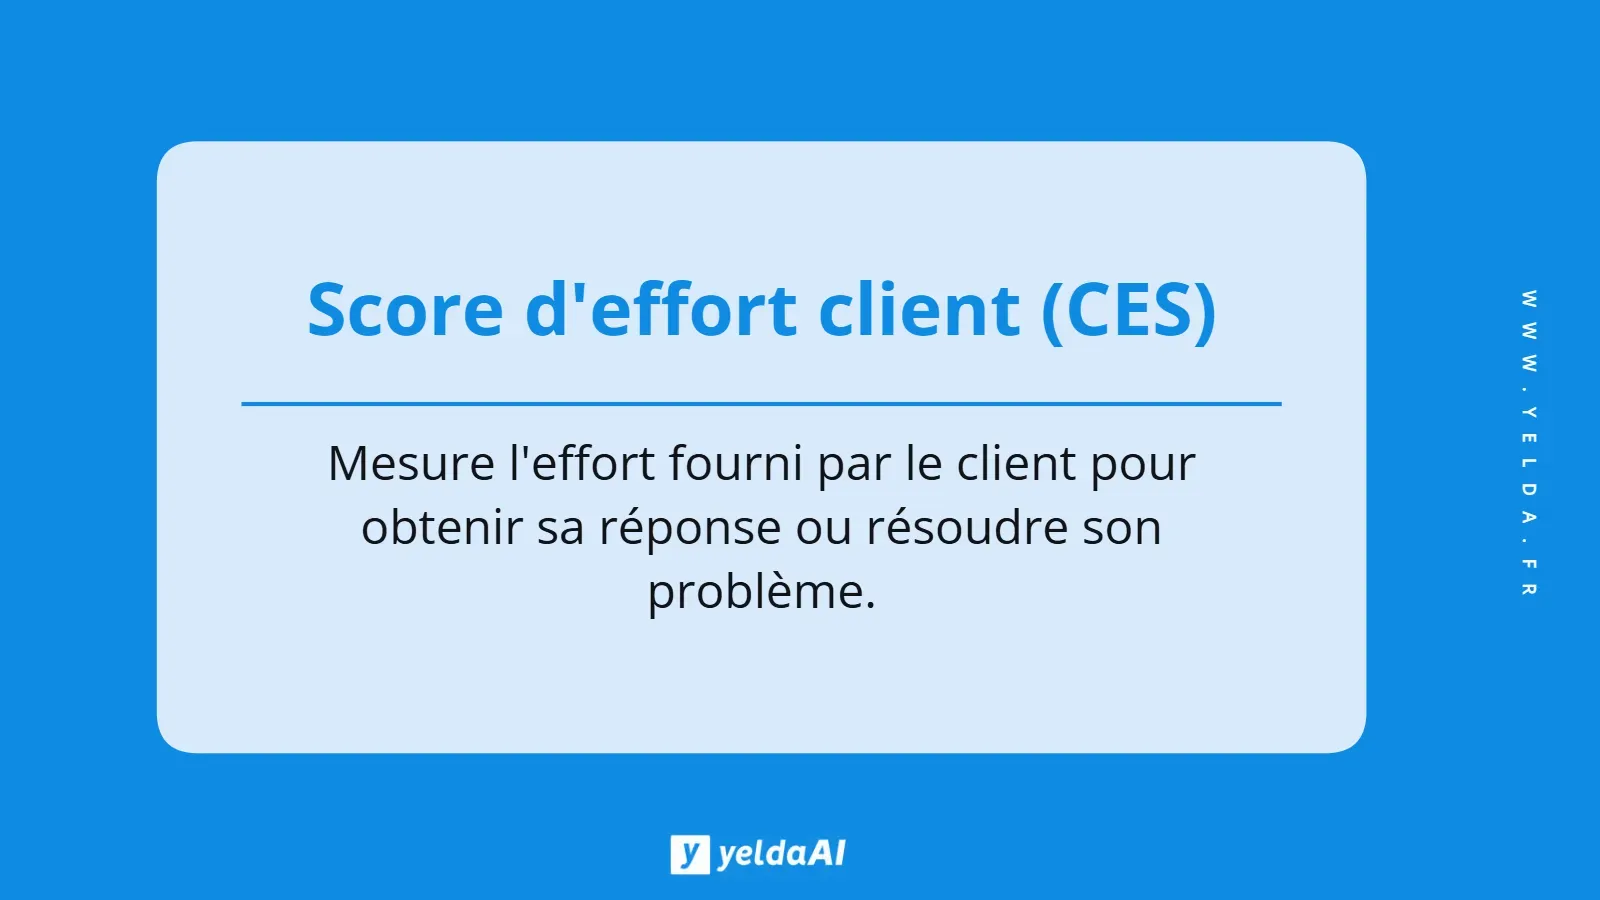
Calculating the Customer Effort Score is relatively straightforward. Following an interaction, customers are asked a question using a scale from 1 to 7, ranging from Very easy to Very difficult. A typical question would be: How easy was it to contact our after-sales service?
The higher the average CES result, the more important it is for the company to simplify the process and improve customer satisfaction.
3. Net Promoter Score (NPS)
The Net Promoter Score (NPS) is an essential indicator of customer loyalty. It measures how likely a customer is to recommend a company to others.
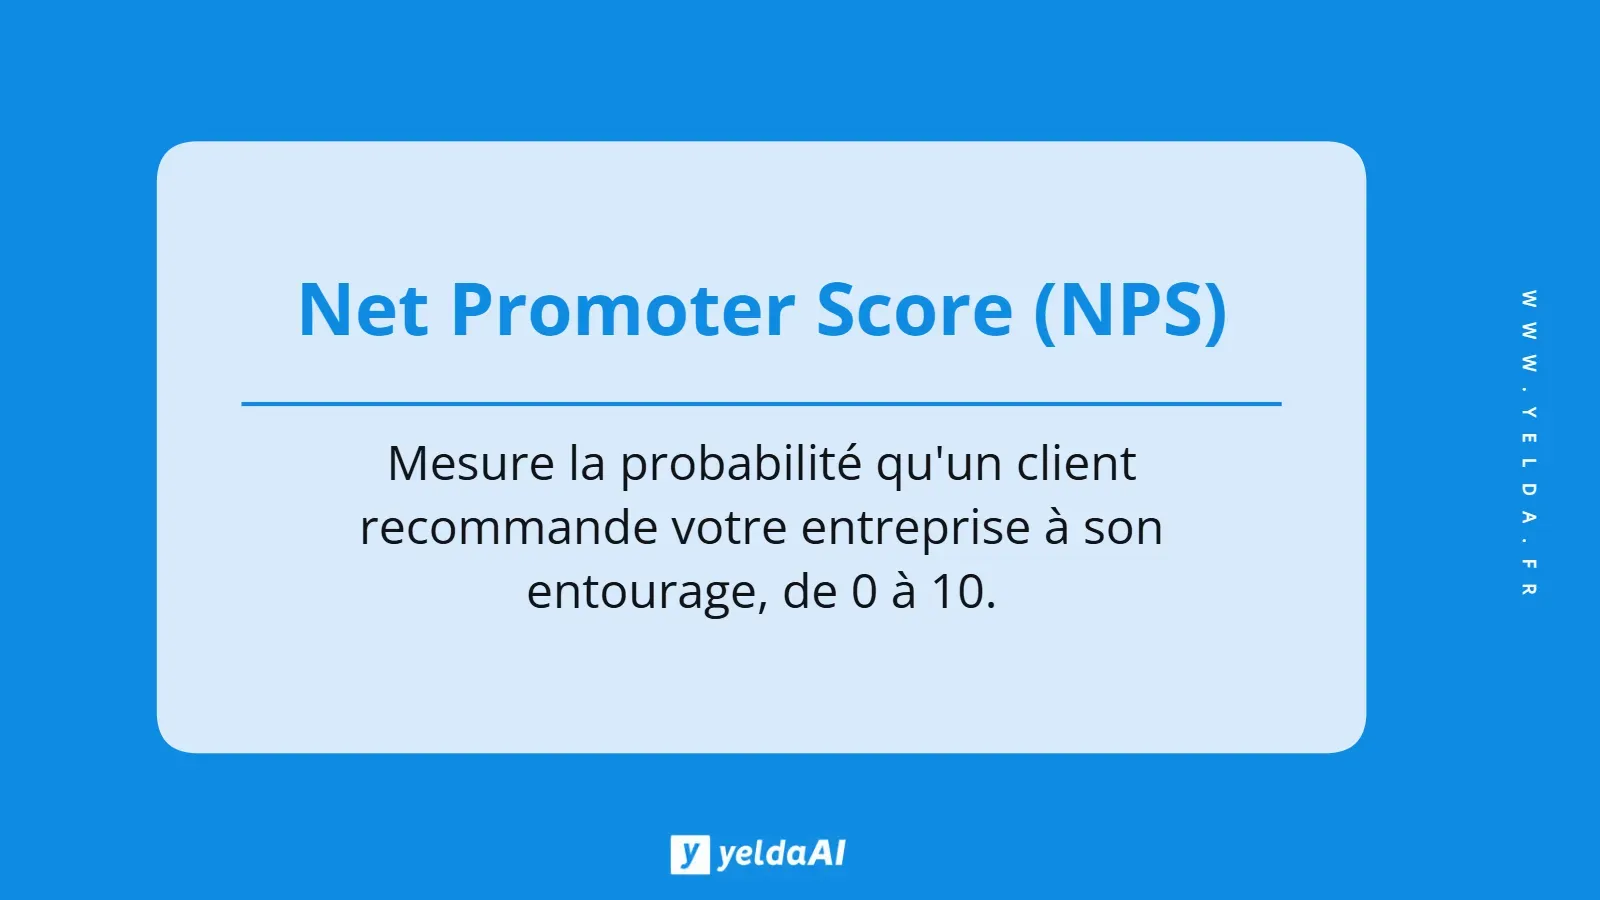
To calculate it, customers are usually asked one question: How likely are you to recommend our services to a friend or colleague? They answer on a scale from 0 to 10.
Based on their answers, customers are divided into 3 groups:
- Promoters: scores of 9 to 10
- Passives: scores of 7 to 8
- Detractors: scores of 0 to 6
NPS is obtained by subtracting the percentage of detractors from the percentage of promoters. Expressed using respondent counts, the formula is:
NPS = [(Number of promoters − Number of detractors) / Number of respondents] × 100
4. Number of support tickets opened
The number of support tickets opened is an essential KPI for measuring customer service activity. It represents the volume of support requests received by the department, regardless of their source: email, phone, social media, and other channels.
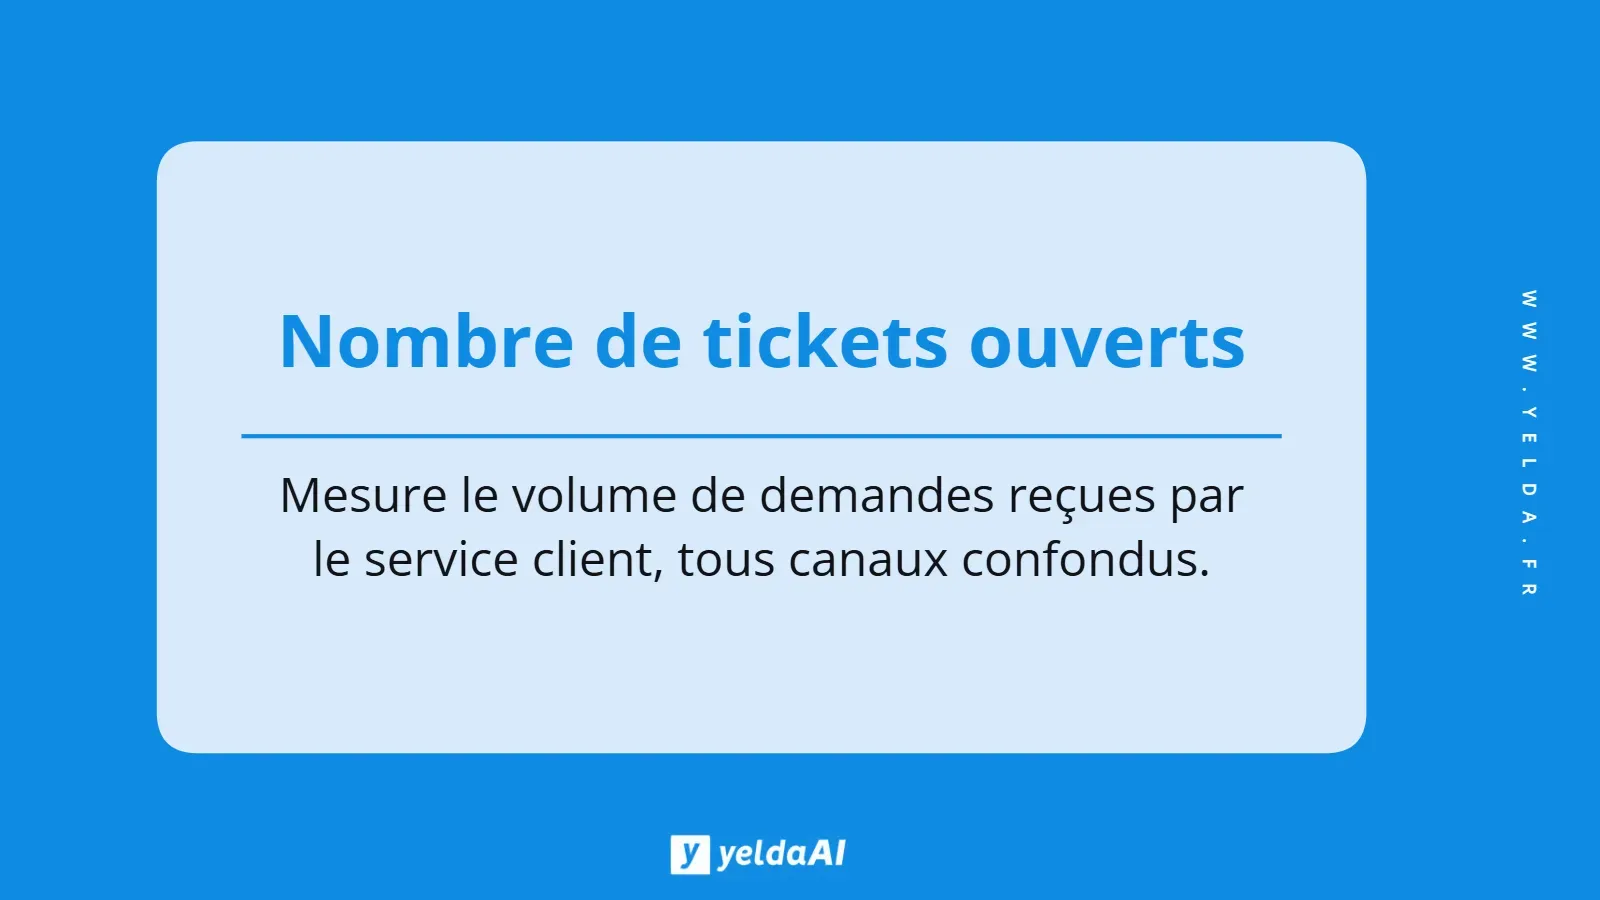
Monitoring this indicator helps track support teams' workload and identify busy periods. It also helps assess customer service efficiency by measuring the team's ability to handle a steady stream of requests within a given time.
Changes in the number of tickets opened must be interpreted in context. During a marketing campaign, for example, an increase may indicate success and more interactions. In another context, a decrease may reflect greater call center efficiency, improvements in product quality, better self-service tools, or similar changes.
5. First Contact Resolution (FCR)
First Contact Resolution measures a company's ability to resolve customer requests during the first contact. More specifically, it is the percentage of customer requests handled during the first interaction.
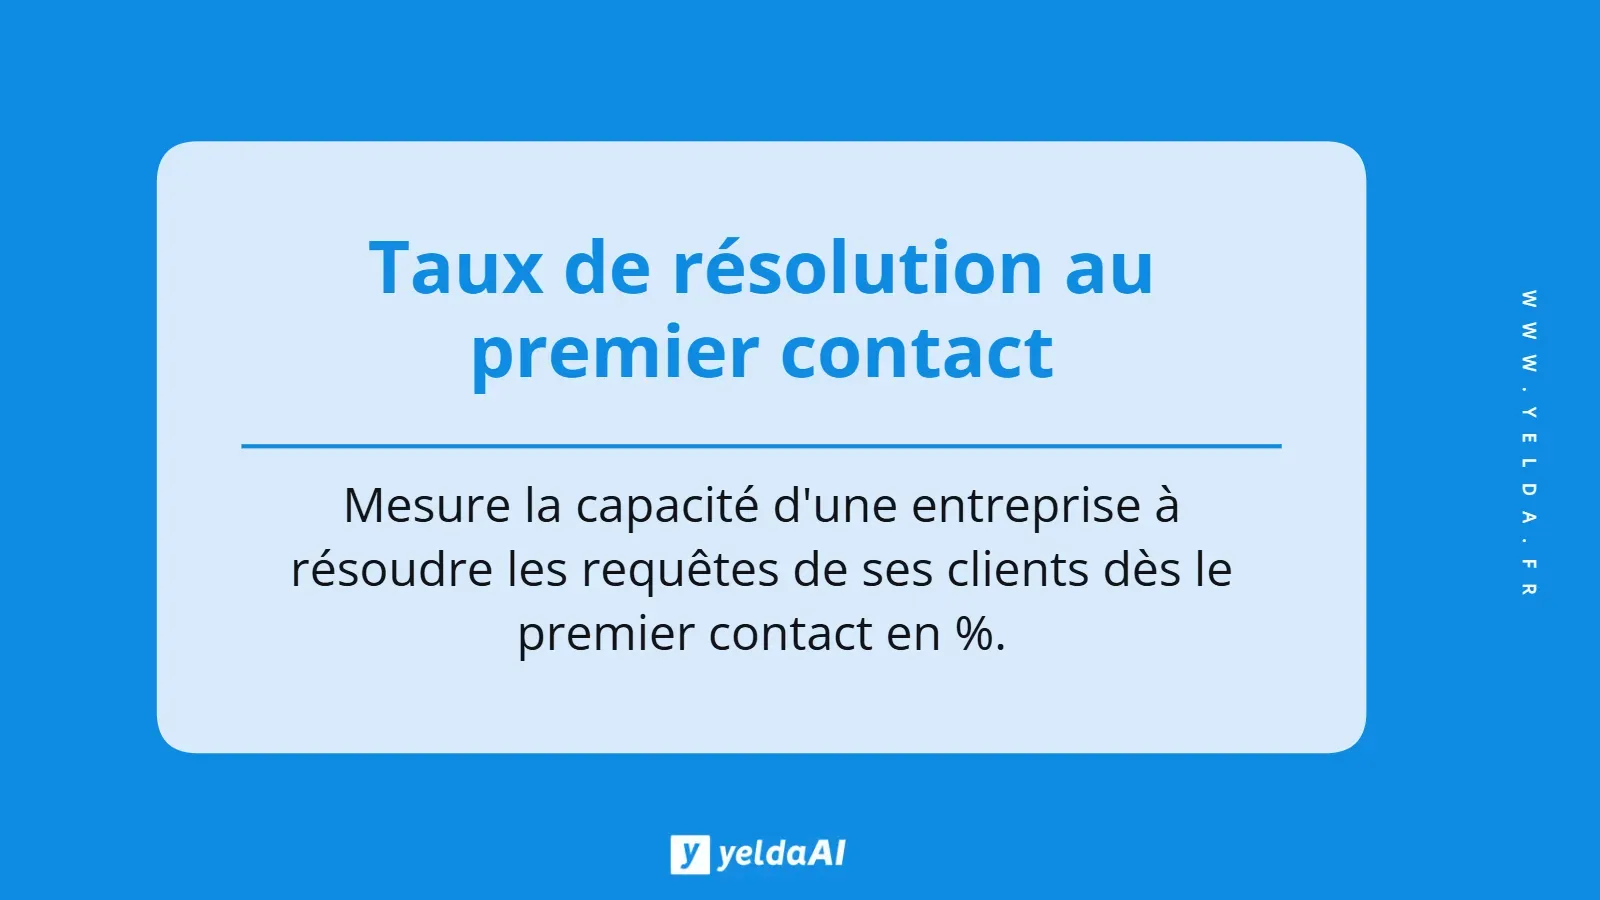
Alongside its direct impact on customer satisfaction, FCR reduces the number of interactions needed to solve a problem, which lowers costs for the company.
To calculate it, divide the number of requests resolved at first contact by the total number of requests, then multiply by 100.
FCR = (Number of requests resolved at first contact / Total number of requests) × 100
6. Overall resolution rate
Unlike FCR, the overall resolution rate measures the percentage of all requests resolved, regardless of the number of interactions required. A high rate often indicates effective and responsive customer service.
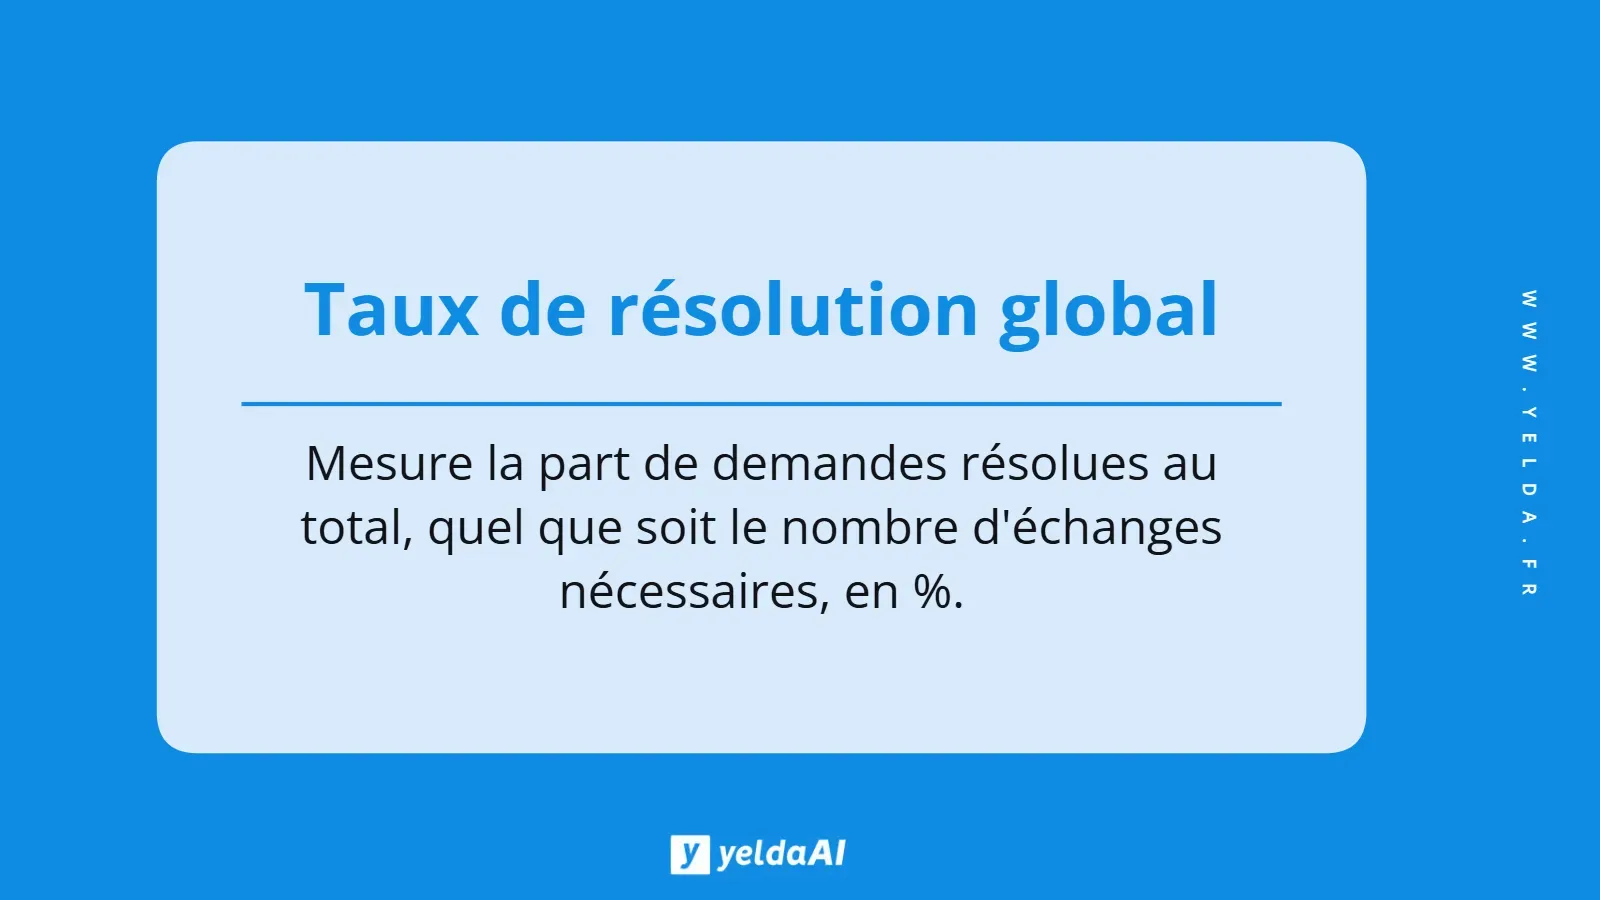
Closely linked to customer satisfaction, this KPI assesses the customer service team's ability to resolve requests sustainably. A better customer experience leads to greater loyalty and a stronger brand reputation.
To calculate this rate, divide the total number of problems resolved by the total number of problems received, then multiply by 100.
7. Average Handle Time (AHT)
Average Handle Time, or AHT, is the average time an agent spends handling a customer request. This KPI reflects how efficiently a customer service team manages inquiries.
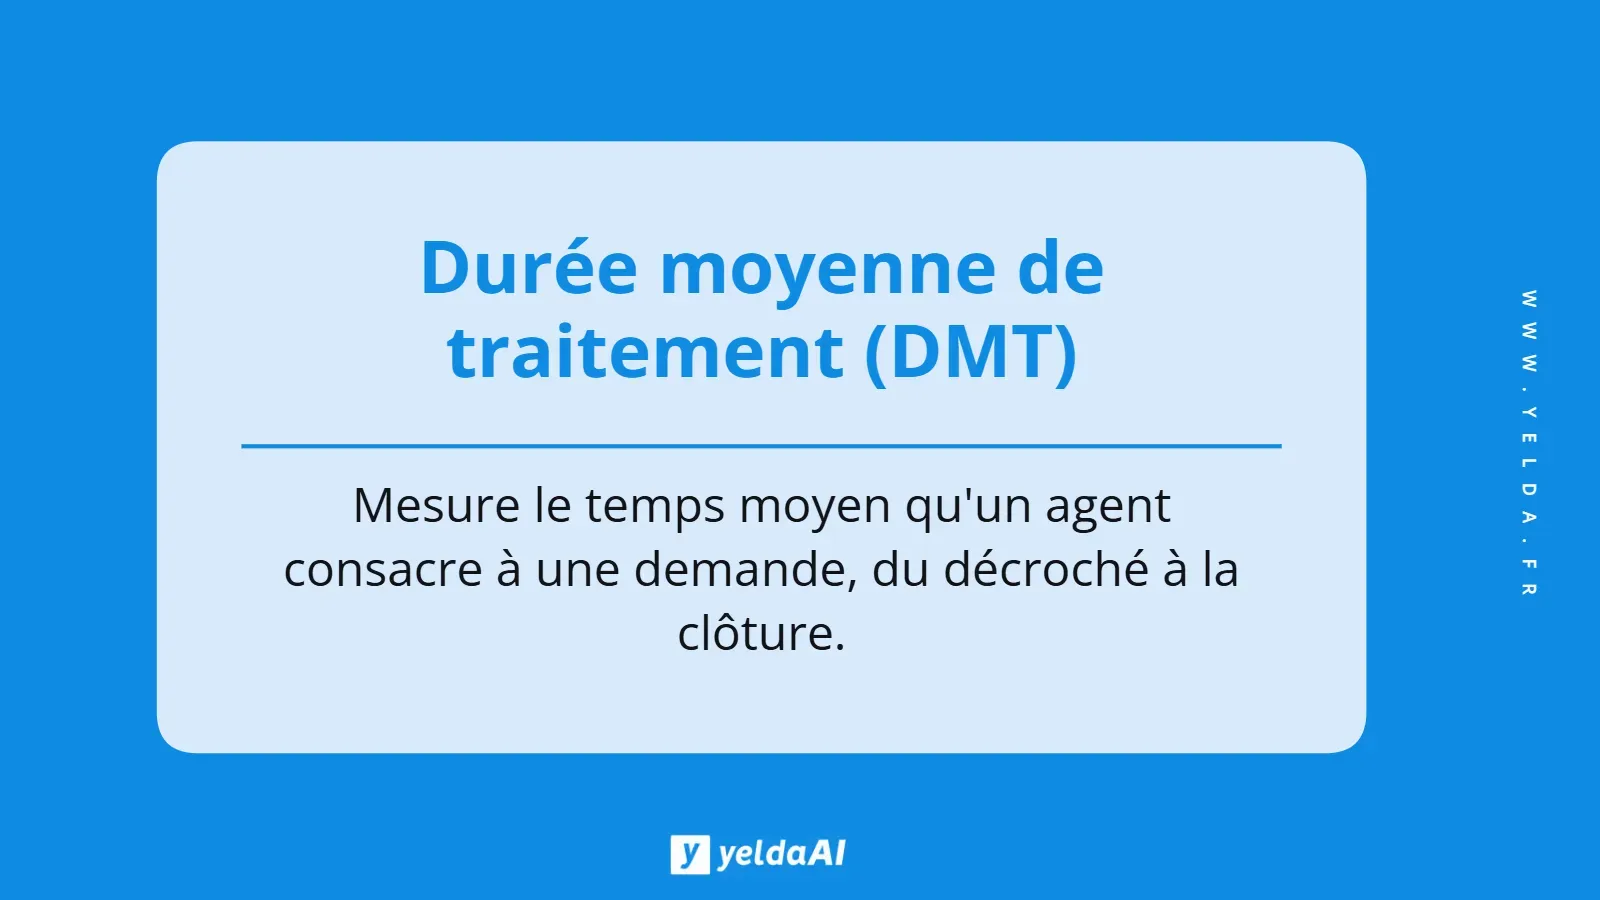
Why treat AHT as a key indicator? First, it helps assess customer service team productivity and identify potential improvements. It also provides an overall view of changes in the department's performance over time.
Calculate AHT by dividing the total time agents spend handling requests by the total number of requests.
AHT = Total time spent handling requests / Total number of requests
8. Customer churn rate
The customer churn rate, also known as the attrition rate, measures the percentage of customers who stop using a service over a given period. It primarily reflects the company's ability to retain customers. A high churn rate may signal underlying problems in the customer experience. In such cases, the causes must be analyzed and strategies introduced to improve retention.
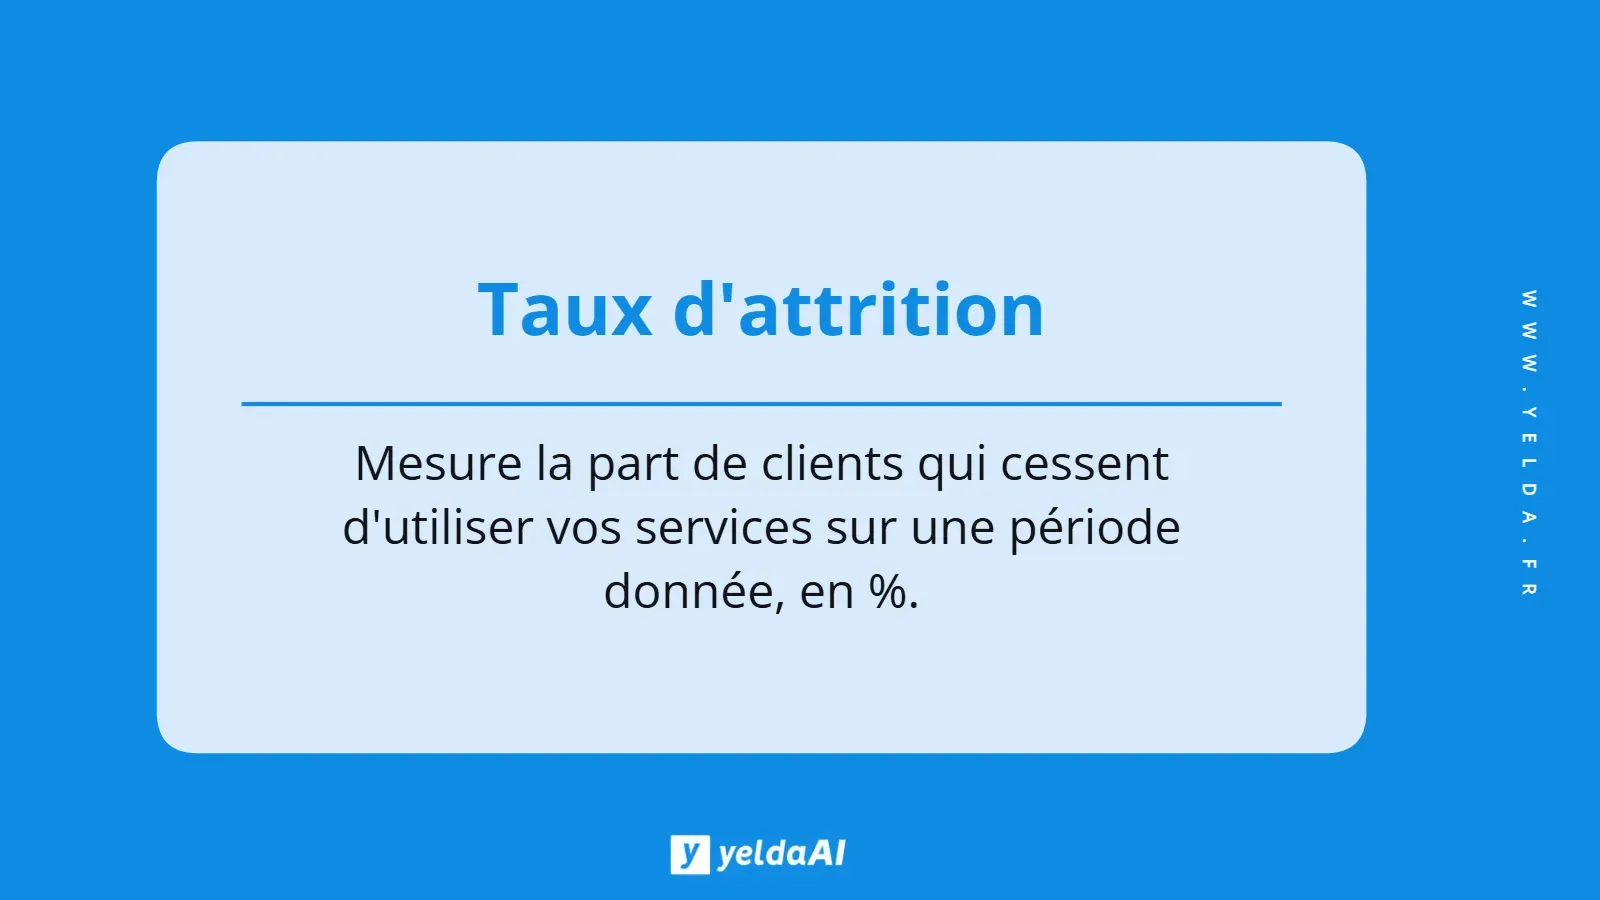
Calculate churn by dividing the number of customers lost during a period by the total number of customers at the start of that period, then multiplying by 100.
Churn rate = (Number of customers lost / Total number of customers at the start of the period) × 100
9. Customer perception of service quality (SERVQUAL)
SERVQUAL is a model used to assess customer service quality and customer satisfaction. It is based on five key dimensions:
- Reliability: the ability to respond to customer requests accurately and consistently.
- Assurance: the competence and credibility of customer support teams.
- Tangibles: the physical aspects of the service, such as premises and equipment.
- Empathy: staff's ability to understand and respond to each customer's individual needs.
- Responsiveness: how quickly the service responds to customer requests.
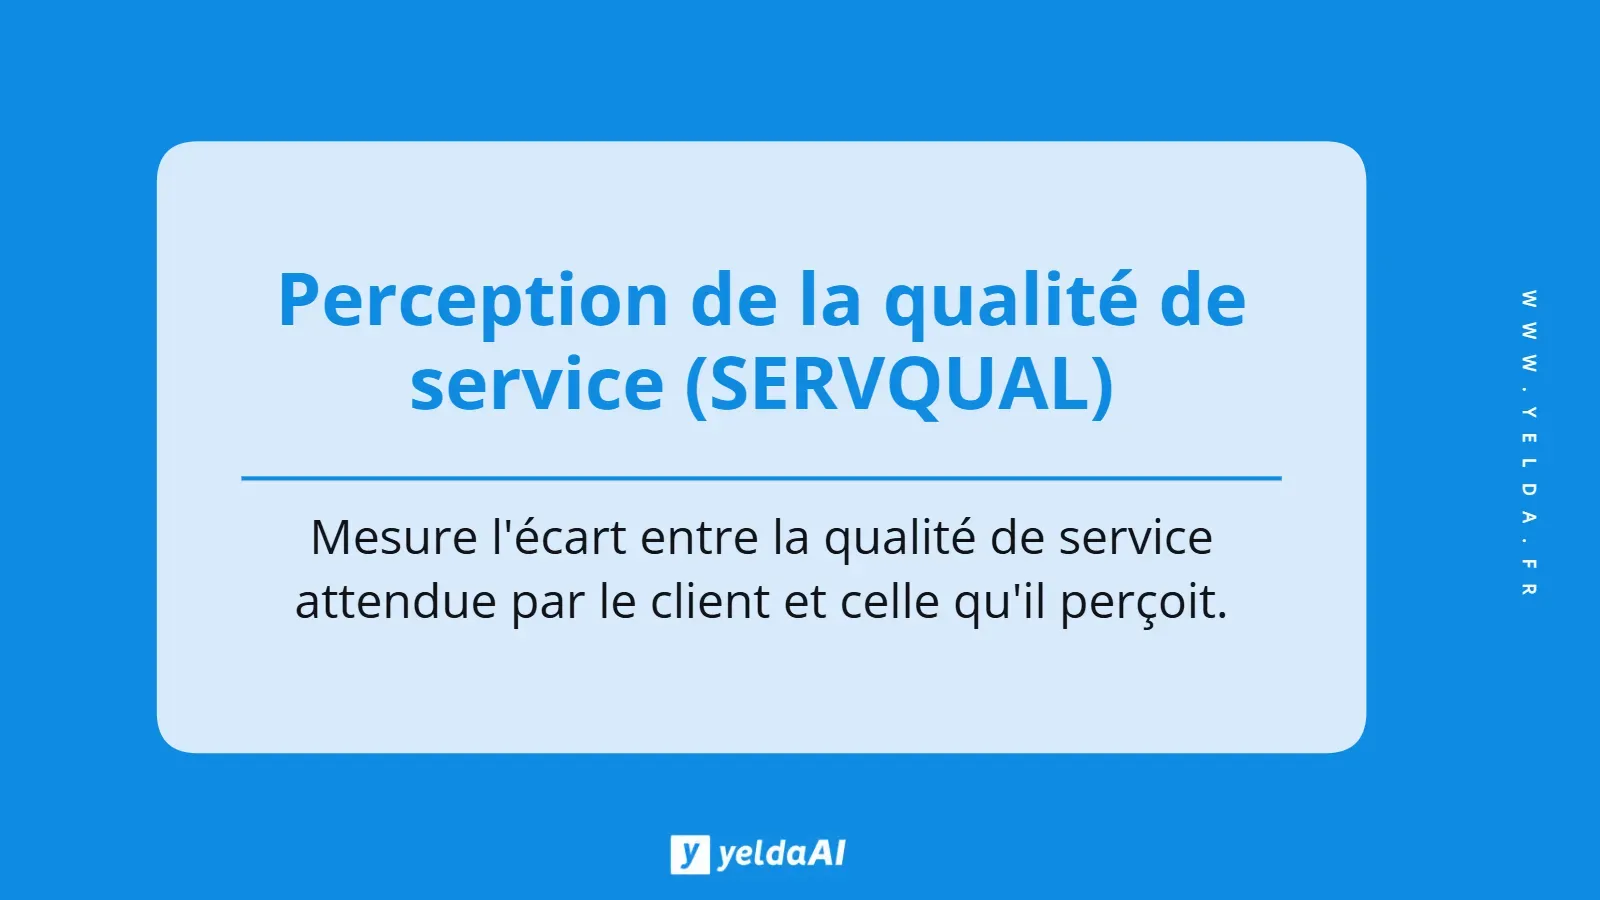
SERVQUAL is measured using a questionnaire presenting customers with a series of statements covering the model's five dimensions. Results are then analyzed to identify gaps between customers' expectations and their actual perception of the service received.
10. Service Quality Indicator (SQI)
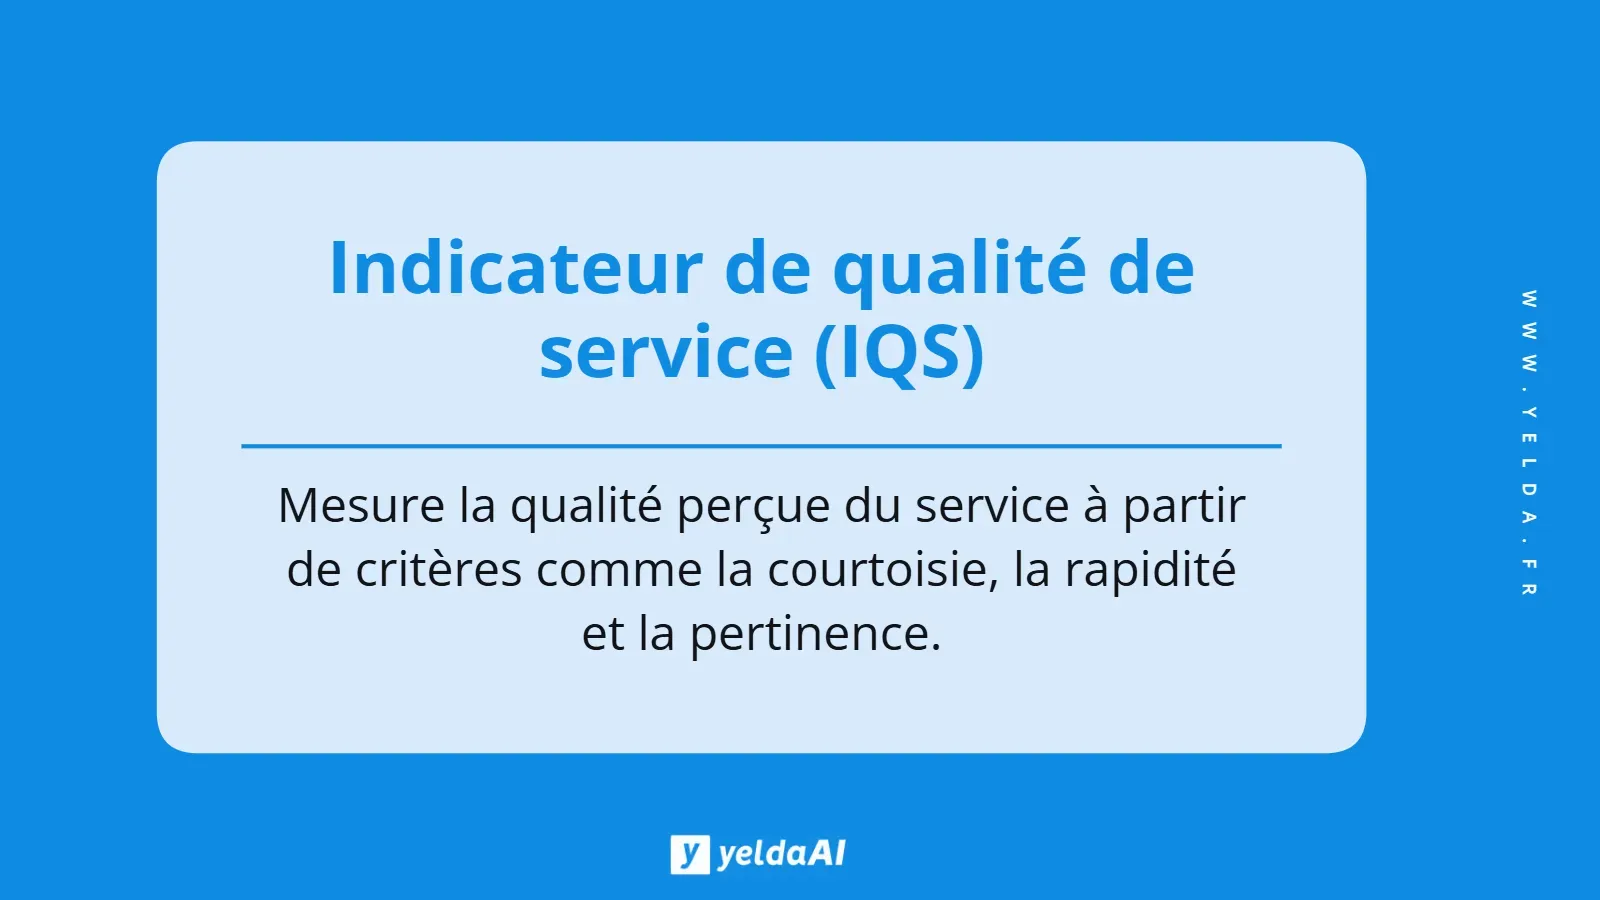
The Service Quality Indicator represents a set of quantifiable measures used to assess customer service quality at different levels. It is an essential assessment tool that directly influences a company's reputation and competitiveness.
One of SQI's main benefits is its ability to identify customer expectations and help adjust services accordingly. A strong SQI often results from attentive listening and responses tailored to customers' needs.
Although there are several methods for calculating SQI, one of the most common uses a customer satisfaction questionnaire. It is based on specific criteria such as staff courtesy, response speed, and the relevance of the answers provided. Responses are then analyzed to calculate SQI, usually expressed as a percentage.
Other indicators to monitor
You can also track other indicators:
- Self-service rate: the percentage of customer requests resolved without human intervention through FAQs, chatbots, callbots, or customer portals.
- First response time: the average time between receiving a customer request and providing the first response.
- Abandonment rate: the percentage of customers who leave a call or chat before a human agent handles it.
- Cost per contact: the average cost generated by each customer interaction across all channels.
- Ticket reopening rate: the percentage of closed requests reopened because the resolution was incomplete.
- Transfer rate: the percentage of requests requiring escalation or transfer to another department.
- Average wait time: the average time a customer waits before being served.
How do you choose the right KPIs for your customer service?
Tracking ten indicators at once only makes sense if each supports a decision. Many teams collect metrics out of habit and end up with a dashboard nobody opens. Four practices are enough to identify what matters.
Link every indicator to a specific goal
A KPI without a related goal is simply unused data. Before adding a metric, state what you want to achieve:
- reduce cost per contact;
- shorten response times;
- improve customer retention.
You will then know which number to monitor, how often to review it, and what action to take when it changes. A useful call center KPI is one for which you already know what to do if performance deteriorates.
Combine customer perception with operational performance
Perception indicators, such as CSAT, CES, and NPS, describe how customers feel, while operational indicators explain why they feel that way. Average Handle Time, the number of support tickets opened, and the First Contact Resolution rate belong to this second group.
Each can be misleading in isolation: a satisfactory CSAT may conceal intolerable wait times during a specific time slot.
Always pair a perception metric with an operational metric, because comparing the two helps identify the cause.
Take stock before adding metrics
Before creating a new indicator, list those already used by your teams: what is measured, how it is calculated, and who is responsible for it. This exercise can reveal surprises, since marketing, operations, and after-sales teams sometimes measure the same thing using different formulas.
This preliminary review avoids duplication and decisions based on figures that cannot be compared. It also reveals metrics nobody uses anymore and that should be removed from the dashboard.
Focus on what you can manage
A management committee follows two or three high-level figures. Operational teams need more detailed indicators that they can influence from one week to the next.
Build a two-level dashboard instead of one list of twenty metrics. Five to seven indicators per team are more than enough, especially since small improvements add up and eventually improve the overall scores.
Conclusion
Choosing the best KPIs for your customer service department is only useful if you use them effectively. Link each key performance indicator to a goal, while ensuring that every KPI is reliable, specific, and simple.
To optimize processes and increase customer satisfaction, act on the results using insights from KPI analysis. Sharing these results with the teams concerned also encourages engagement and continuous improvement.
How many calls can your voice agent absorb?
Estimate in one minute the number of automated calls and the savings on your own volumes, with our ROI calculator.