
Customer service analytics: what it is and how to do it
How to turn customer service data into better experiences: definition, the 4 types of analytics, use cases and the KPIs that matter.


Understanding your customers' needs and preferences is essential. It is how products, services and customer experiences get better.
Customer service analytics is a powerful way for companies to examine large amounts of data from customer interactions and feedback. It provides valuable insights to improve customer support, marketing and product development, leading to concrete solutions and better business results.
What is customer service analytics?
Customer service analytics starts with collecting and analyzing data from customer interactions. These interactions happen across many channels and provide very useful information to improve the customer experience and business results.
It goes well beyond simple data collection: it is an in-depth analysis of customer behavior, preferences and sentiment.
Data can come from phone calls, chat logs, emails, surveys or social media interactions. By turning raw data into actionable insights, companies can spot patterns and trends that reveal customer preferences, behaviors and potential problems, and refine their strategies to deliver more personalized and effective experiences.
Example: software company Hotjar analyzes support conversations with advanced tools such as AI and natural language processing to improve its marketing, product development and customer experience.
Why does customer service analytics matter?
Customer service analytics helps companies identify key areas for improvement, understand overall customer sentiment and optimize customer service processes and operations.
According to Gartner, 84% of customer service leaders consider data and analytics "very or extremely important".
Customer service analytics also feeds customer journey mapping. Companies can use it to better understand interactions at each touchpoint and improve loyalty with more precise targeting and more effective marketing.
Higher customer satisfaction
Customer service analytics plays a key role in improving customer satisfaction scores. By better understanding friction points and expectations, companies can adapt their services and increase overall satisfaction.
Example: meal kit company Gousto uses customer service data to optimize its operations and marketing campaigns.
Operational efficiency
Customer service analytics reduces support costs by identifying common customer problems and optimizing resolution processes. Companies can handle more requests more efficiently while reducing handling times.
According to Salesforce, 69% of service agents struggle to balance speed and quality. Optimizing processes improves resource allocation and operational efficiency.
Example: Uber uses customer service analytics tools to manage interactions across platforms, resolve customer issues and streamline support operations.

Better data-driven decisions
Customer service analytics plays a key role in decision making and in building a culture of fact-based decisions.
Managers and decision makers can improve customer service strategies and product offerings based on these insights. James Villas, for example, uses customer service analytics to identify and prioritize urgent tickets.
What are the main types of customer service analytics?
Customer service analytics generally falls into four main categories.
Prescriptive analytics
Prescriptive analytics recommends actions based on historical data and predictive models.
It can be used to anticipate future trends or decide the best course of action in specific scenarios.
If an analytics tool detects a high risk of churn, it can recommend personalized discounts or proactive retention actions.
When a customer is unhappy about a problem, prescriptive analytics can suggest contacting them, apologizing and offering a suitable solution.
Prescriptive analytics is particularly useful for retention, by sharing key indicators with customer service teams. It also helps identify cross-selling and upselling opportunities and offer products and services that better fit customer needs.
Descriptive analytics
If prescriptive analytics tells you what to do, descriptive analytics explains what has already happened.
Companies can use it to examine ticket volumes by channel (email, chat, phone and so on) over a given period. This shows which channels are busiest so resources can be reallocated to improve response times and overall performance.
Over time, descriptive analytics is used to monitor overall performance indicators, so companies can adjust their customer service strategy based on historical trends.
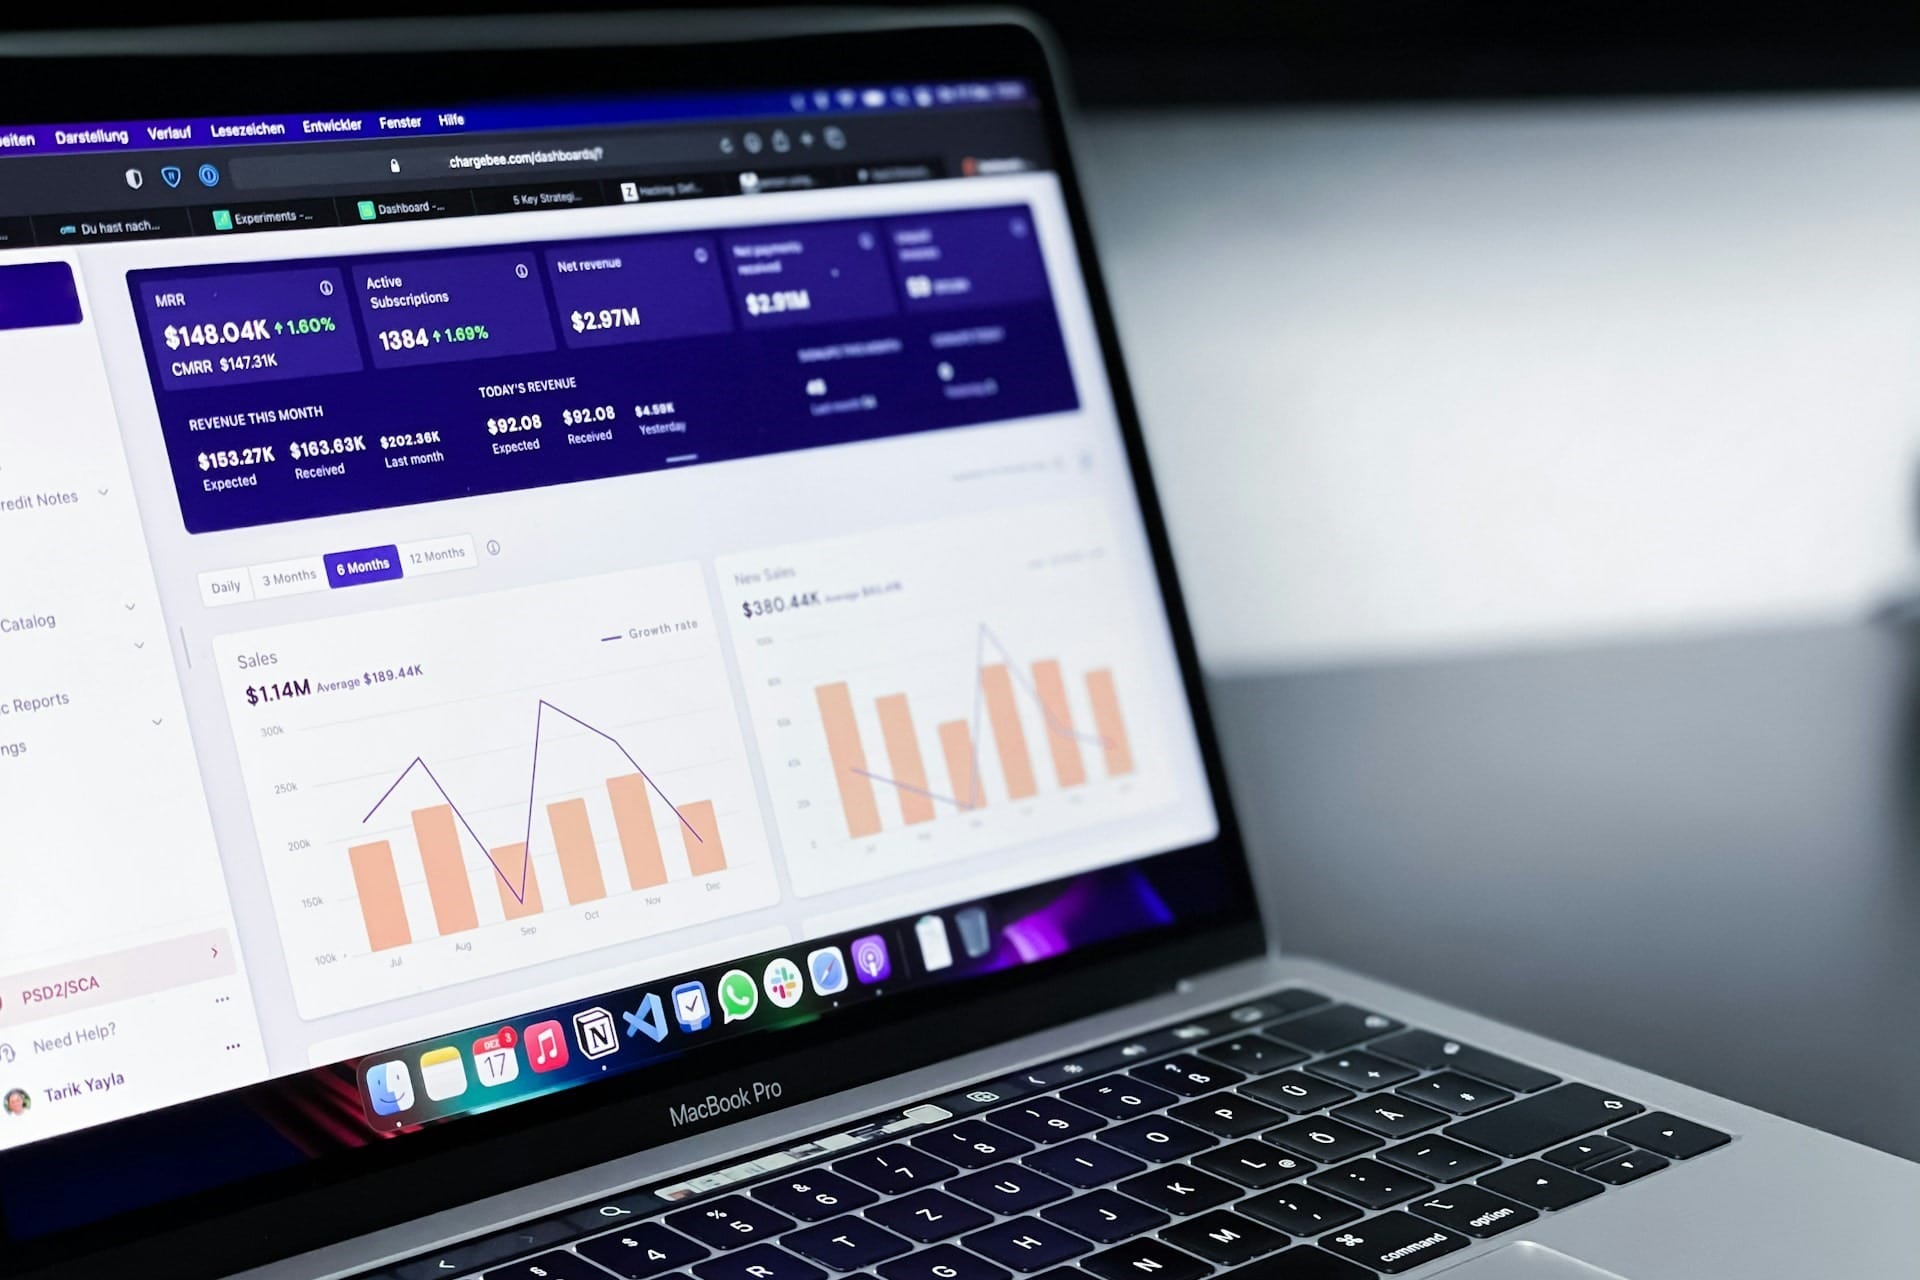
Customer service analytics tools often provide smart reports, including ticket volume, open tickets, average first response time and more.
Predictive analytics
Using historical data, machine learning and statistical algorithms, predictive analytics anticipates future trends so companies can spot potential problems and act preventively.
Customer journey analytics, for example, can map and understand how customers interact with brands across touchpoints. It can also anticipate a rise in support requests at certain times or seasons.
By addressing potential problems before they arise, companies reduce churn. This proactive approach improves the customer experience, optimizes resource management and prepares teams for challenges.
Example: Sprout Social uses predictive analytics to identify upcoming trends on social media. By detecting shifts in customer sentiment or issues before they escalate, it protects brand reputation.
Diagnostic analytics
Companies use diagnostic analytics to identify the causes of problems and malfunctions. It is particularly useful to understand spikes in complaints after a product update or launch, and trace the problem back to its source.
It helps reduce the time needed to resolve complex customer service issues by quickly identifying their origin.
With diagnostic analytics tools, companies can also put preventive measures in place to reduce the risk of past problems recurring.
Example: Zendesk uses diagnostic analytics to understand why customer complaints increase after product updates or campaigns, and find solutions to keep the same problems from happening again.
Customer service analytics use cases
Customer service analytics improves business performance in many areas. Companies that use it are better placed to anticipate customer needs and expectations, and to make sure product features and improvements resonate with their target market.
Building self-service tools
Customer service analytics is particularly useful to build effective self-service tools. By analyzing the most frequent problems and questions, companies can create detailed FAQs and knowledge bases, or train chatbots to solve problems autonomously.
Example: Gousto used customer service analytics to build comprehensive FAQs and knowledge bases, and its overall operations also became smoother.
Better product development
Customer service data is also essential for product development. It shows what customers like, what bothers them, what they find hard to use and what needs urgent changes.
Analyzing the reasons for product returns gives valuable guidance, whether to improve an existing product or design a new one.
Bonfire, a Web3 community platform, used behavioral analytics to segment its customers and improve feature adoption and activation, which significantly strengthened retention and sped up time to market.

Better customer experience
Customer service analytics and customer experience are closely linked. Use the insights to proactively address dissatisfaction and improve the overall experience.
These tools are particularly useful to monitor customer sentiment on social media, which is essential to manage reputation issues, given how much customer experience weighs in buying decisions.
Customer service analytics metrics and KPIs
As with any data, tracking key performance indicators is crucial.
These KPIs help identify customer trends and behaviors and build strategies to strengthen engagement and loyalty while reducing churn. They fall into two categories: customer experience KPIs and customer retention KPIs.
Customer experience KPIs
Customer satisfaction score
The customer satisfaction score measures a customer's overall satisfaction with a service or product.
To calculate it, ask customers to rate their satisfaction on a scale of 1 to 10, 10 being the best score.
Qualaroo uses feedback software to collect satisfaction data and analyze it with AI.
Average handle time
Average handle time (AHT) is the time needed to resolve a customer issue, including every step: waiting time, interaction with agents and follow-up actions.
Every company should aim to reduce its AHT.
First response time
First response time is the time it takes for a customer to get an answer from an agent. The shorter it is, the higher customer satisfaction.

Customer retention KPIs
Retention KPIs are essential to secure customer loyalty.
Net promoter score (NPS)
The net promoter score is a customer loyalty indicator, calculated by asking customers how likely they are to recommend your brand to others.
In general, a high NPS means strong brand engagement.
Userpilot, for example, uses customer analytics tools to run NPS surveys and analyze the results to identify detractors, who are then segmented and contacted proactively to address their concerns and reduce churn.
Customer effort score (CES)
The customer effort score measures how much effort customers make to solve their problems. Unlike other indicators, a low CES is better, and is usually linked to high customer satisfaction.
To calculate it, ask customers to rate how easy it was to solve their problem on a scale of 1 to 5, 1 to 7 or 1 to 10.
Customer lifetime value
Customer lifetime value is the total revenue a customer generates over their relationship with the company. Loyal customers have a higher lifetime value.
To calculate it, first determine the average purchase value (total revenue divided by the number of purchases over a period). Then calculate the average purchase frequency. Finally, estimate the customer lifespan, the period during which a customer keeps buying from the company.
Multiply the average purchase value by the purchase frequency and the customer lifespan to get the customer lifetime value.
Customer retention rate
The customer retention rate measures the percentage of customers a company keeps over a given period. A high retention rate reflects strong customer satisfaction with the brand.
Churn rate
The churn rate is essentially the opposite of the retention rate: it measures the rate at which customers stop doing business with a company.
A high churn rate means low loyalty. Monitoring it is crucial to identify potential problems with products or services, especially in customer service, where customers can be lost as easily as they are won.
Customer service analytics is a very powerful way for companies to better understand their customers' behaviors, preferences and pain points. It improves customer satisfaction, operational efficiency and decision making, strengthening the customer experience and brand loyalty.
Adopting customer service analytics will be a key differentiator for any company, especially when used to create effective customer experiences. It is no longer optional but essential for lasting growth.
Tools exist to help you collect and analyze this data, such as YeldaAI and its AI-powered callbots.
Estimate what a voice agent could save on your own call volumes with our ROI calculator.
How many calls can your voice agent absorb?
Estimate in one minute the number of automated calls and the savings on your own volumes, with our ROI calculator.